August 1, 2017
Book Publishing Annual StatShot Survey Reveals Religious Crossover and Inspirational Books Supported Trade Book Growth in 2016
Print books account for 70.6% of all units sold; eBook revenues decline
Washington, DC; August 1, 2017 – The Association of American Publishers (AAP) announced today that the U.S. book publishing industry generated $26.24 billion in net revenue for 2016, representing 2.7 billion in units (volume). Books with religious and inspirational themes from religious presses and trade publishers were among the best-selling books.
StatShot Annual estimates the book publishing industry’s size and scope, tracking the sales and volume data for trade (fiction/non-fiction/religious), PreK-12 instructional materials, higher education course materials, university presses, and professional books.
While publisher revenue (1.5%) and units sold (2.8%) both increased for trade books, the overall publishing industry saw a decline in revenue (-5.1%.) This may in large part be attributed to a challenging year in the education and scholarly publishing markets, which together comprise about 40% of tracked revenues.
Publisher revenue for trade books grew by $231 million from 2015 to 2016. American publishers sold nearly 2.5 billion trade books, including print, eBook and audiobooks.
Trade Books
Trade Category: Net Revenue and Unit Growth

Most of the inspirational and religious crossover books that were popular in 2016 are found in the religious presses and Adult non-fiction categories. Since 2014, Adult non-fiction has been the category with the greatest revenue growth, gaining nearly $1 billion. The category went from $4.97 billion in 2014 to $5.87 billion in 2016. Among other books, the category includes memoirs, biographies, inspirational books, political books, and adult coloring books. Within Adult non-fiction, about 80% of the books sold were print, the majority being paperback books. Religious presses, imprints that focus on religion, spirituality and faith, grew by 6.9% to $1.13 billion from 2015 to 2016.Area of Growth: Inspirational and Religious Crossover Books
“Books that emphasized values, simple living or had inspirational messages like the Magnolia Story, Present Over Perfect, The Life-Changing Magic of Tidying Up, and Uninvited were among the most popular in 2016,” said Tina Jordan, Vice President of Trade Publishing, Association of American Publishers.
Childrens/Young Adult Books and Adult Books
Both fiction and non-fiction Childrens and Young Adult Books saw revenue and unit growth. The overall Childrens/YA Books category grew by 5.9% from $4.22 billion in 2015 to $4.47 billion in revenue in 2016. In all, about 1 billion Childrens/YA books were sold to bookstores, online retailers, directly, or otherwise. Nearly 90% of the books sold in Childrens/YA books in 2016 were print books. eBooks declined from a high of 8.6% share of market in 2012 to 3.3% in 2016 and downloaded audio rose from 0.3% share of market in 2012 to 1.2% in 2016.
The Adult Books category shrank 0.9% in 2016 vs. 2015. The nearly 1.3 billion Adult books sold in 2016 encompassed 65% of trade publisher revenues for the year. While publisher revenue for Adult non-fiction has grown every year for the past five years, growing by 22.9% since 2012, Adult fiction has done the opposite, slowly bringing in less revenue each year.
Within the Adult books category, the fastest growing formats in terms of units sold were downloaded audio (up 18.8%), and paperback (up 7.3%). In 2016 print books comprised 66.9% of the books sold, audiobooks were 5.9%, eBooks were 23.1%, and other formats were 4.7%. In 2012, the mix was 66.4% print books, 3.6% audiobooks, 28.4% eBooks and 2.7% other formats.

Trade Formats: Downloaded Audio Grew Significantly, eBooks Declined
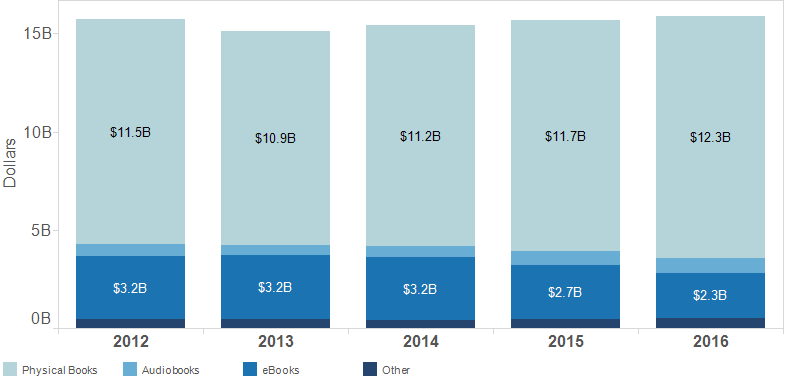
Paperback books: Remaining the most popular format overall in terms of units sold, more than 1 billion paperback books were purchased in 2016, comprising 41.7% of the market. Mass market adds another 7.4%. Revenue was up for paperbacks in 2016 to $5.57 billion from $5.29 billion in 2015. This is the most popular format for Adult non-fiction book readers.
Downloaded audio: As they have each year for the last three years, both unit sales and publisher revenue grew by double digits. More than 16 million additional units were sold in 2016 than in 2015, representing 24.7% growth. While downloaded audio represents a small percentage of books sold (3.3% of units) it’s becoming an increasingly popular category – especially for Adult fiction readers. Both unit sales and revenue have more than doubled for this format since 2012, growing from $299 million to $643 million in 2016.
eBooks: Publisher revenue and unit sales for eBooks declined for the third year in a row, losing about $1 billion since their peak in 2013 when revenues were $3.24 billion. In 2016, publisher revenues for eBooks were $2.26 billion, down 16.9% from 2015. Unit sales also declined by 14.7%, with eBooks now making up 14.0% of the trade book market, down from 16.9% last year. Within the Adult fiction book category, eBooks are the most purchased format with 33.0% of the market.
Hardback books: While they are not the best-selling format, hardback books remain quite popular. Both unit sales and publisher revenue increased for the second consecutive year. Revenue was up $265 million (4.9%) in 2016 and 10 million more units were sold (1.7%).
Number of Trade Book Units Sold by Format

- Print
- Paperback & mass market: 1.22 billion
- Hardback: 580 million
- Children’s board books: 96 million
- Digital
- eBook: 348 million
- Downloaded audio: 82 million
- Other (includes physical audio, bundles, books with unconventional binding): 147 million
Education and Scholarly Books
Education and scholarly books account for about 40% of StatShot revenue, and their decline affected overall revenue for the industry at large. Revenue for PreK-12 instructional materials declined 9.2%, higher education course materials declined 12.6%, professional books declined 22.5%, and university presses declined 5.5%.
The PreK-12 market has historically enjoyed a number of constants, including increasing school enrollment, predictable sales cycles, ongoing changes to teaching and pedagogy that required new materials, and dedicated state revenue for textbooks. The recession, shift to Common Core state standards, and adjustments to school budgets are some likely reasons why this market has slowed over the past two years. More specifically, in 2016 there was a lighter than average market in the key states for new instructional materials and a reduction in state earmarks for books and materials.
The market for higher education course materials is undergoing significant change; notably, education publishers are shifting their resources from print textbooks to interactive digital materials. This change impacts how materials are priced and how students acquire their course materials. Other factors affecting this market include changes among online retailers with regard to purchase practices, students purchasing behaviors, reduced college enrollment and lower completion rates, leading to fewer students purchasing course materials.
Declines amongst university presses, scholarly and professional publishers can in part be attributed to stagnant or strained library budgets.
Online Retail is Top Sales Channel
Most of the books purchased in 2016 were bought from an online retailer; about 814 million units were sold into online channels in 2016. About 672 million books were sold to physical bookstores.
Trade book sales:
For the third year, publishers saw increased revenue from trade book sales at physical retail stores. In 2016, publisher revenue from sales to brick-and-mortar stores grew 1.0% from $4.17 billion to $4.22 billion. Publishers also saw increased revenue from the export of trade books.
These sales channel numbers reflect how publishers get books into the marketplace, not retailers’ revenue from consumers. While StatShot channel sales data can provide directional information about trends, the data is limited for trade books, as much of the business occurs through wholesale and distribution.
About StatShot Annual
Produced by AAP, StatShot Annual estimates the total size of the U.S. publishing industry by collecting sales data in dollars and units from nearly 1,800 active U.S. publishers. Data is collected directly from publishers, with the help of distributors. Estimates are used for publishers who do not participate directly, based on their company financial reports, government filings, BooksinPrint, press releases, third party research services, and other third party sources.
Note: All figures represent publishers’ net revenue from all distribution channels (these are not retailer/consumer sales figures). StatShot Annual captures publishers’ aggregated net revenue from the formats we are able to measure across the different categories.
The StatShot Annual Executive Report with all corresponding data will be available later this summer. To place an advance order for the report, please contact Tina Jordan at tjordan@publishers.org.
About AAP
The Association of American Publishers (AAP) represents nearly four hundred member organizations including major commercial, digital learning, education and professional publishers alongside independents, non-profits, university presses and scholarly societies. We represent the publishing industry’s priorities including copyright and related intellectual property rights, piracy and enforcement strategies, digital growth and related business models, funding for education and libraries, fair tax and trade policies, and freedom of expression and literacy debates.
Find us online at www.publishers.org or on twitter at @AmericanPublish.