January 25, 2021
AAP NOVEMBER 2020 STATSHOT REPORT: PUBLISHING INDUSTRY UP 24.5% FOR MONTH; UP 0.8% YEAR TO DATE

Trade (Consumer Book) Sales Up 34.5% in November; 9.7% Year to Date
The Association of American Publishers (AAP) today released its StatShot report for November 2020 reflecting reported revenue for all tracked categories, including Trade (Consumer Books), K-12 Instructional Materials, Higher Education Course Materials, Professional Publishing, and University Presses.
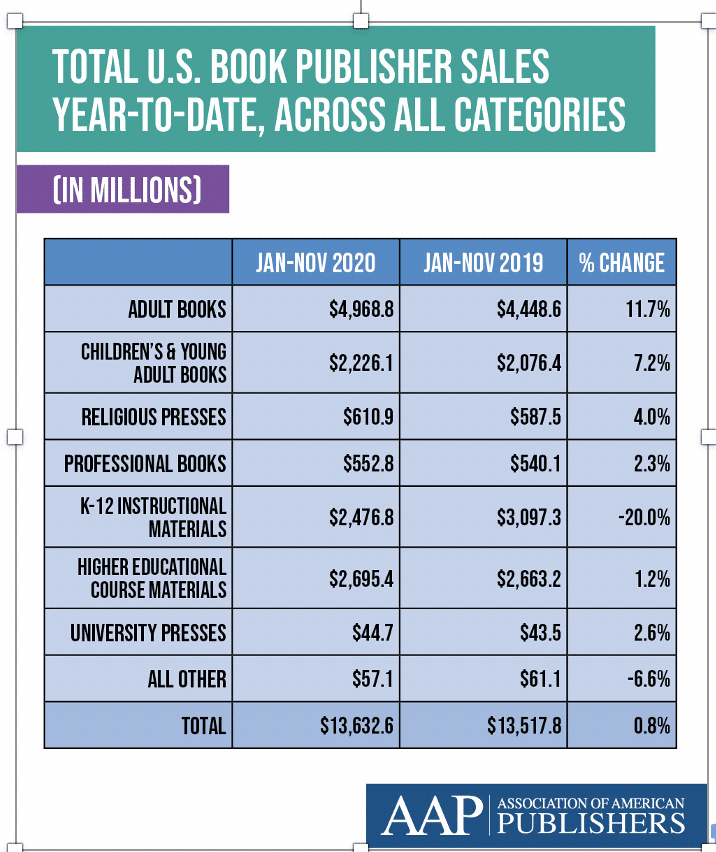
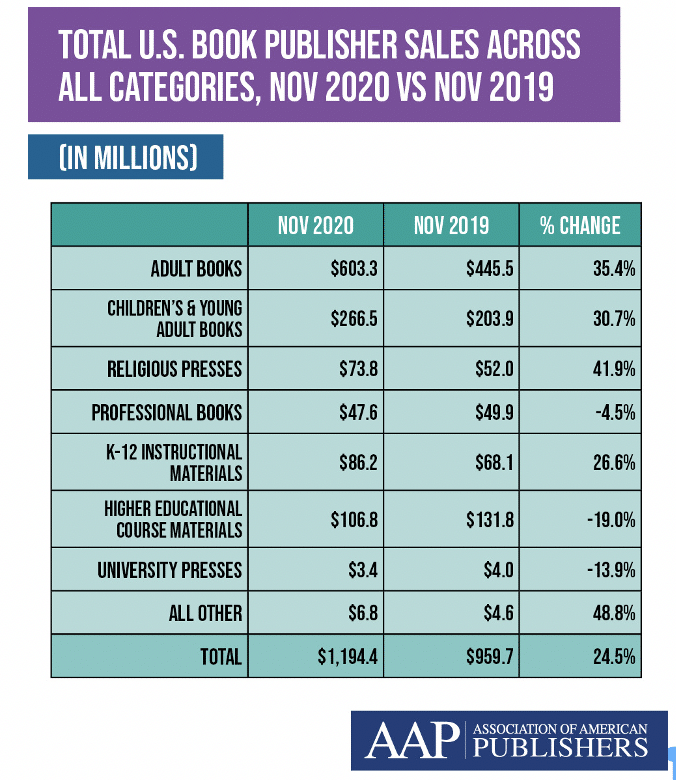
Total revenues across all categories for November 2020 were up 24.5% as compared to November 2019, coming in at $1.2 billion. Year-to-date sales were flat, with an increase of 0.8% as compared to the first eleven months of 2019, with a total of $13.6 billion.
Trade (Consumer Books) Revenues
Trade (Consumer Books) sales were up 34.5% year-over-year, coming in at $943.6 million. Year-to-date (January-November 2020) Trade sales were up 9.7% as compared to the same period last year, coming in at $7.8 billion.
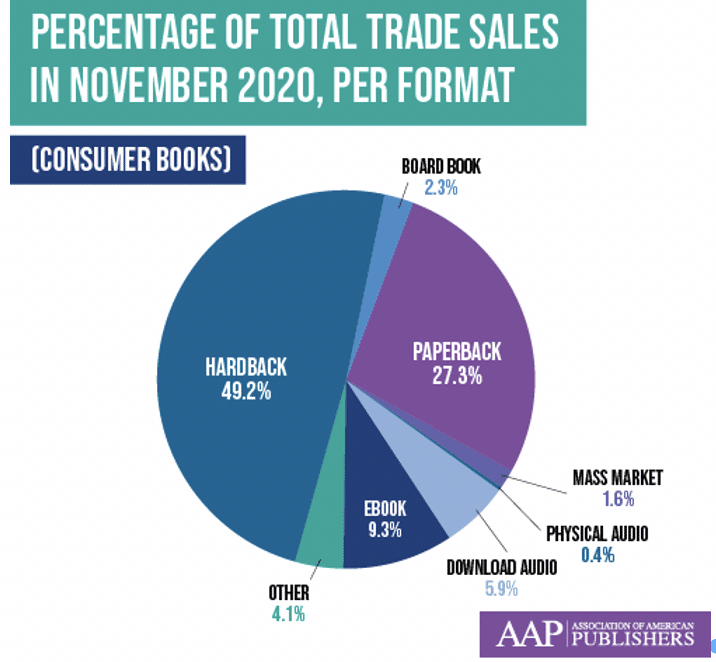
In terms of physical paper format revenues during the month of November, in the Trade (Consumer Books) category, Hardback revenues were up 58.3%, coming in at $464.2 million; Paperbacks were up 35.6%, with $257.2 million in revenue; Mass Market was down 23.2% to $14.7 million; and Board Books were up 27.8%, with $21.3 million in revenue.
On a year-to-date basis, Hardback revenues were $3.1 billion, up 12.8%; Paperbacks were $2.4 billion, up 6.0%; Mass Market was $202.4 million, a decline of 3.0%; and Board Books were $176.1 million, up 19.5% as compared to the first eleven months of 2019.
eBook revenues were up 5.1% for the month as compared to November of 2019 for a total of $87.9 million. On a year-to-date basis, eBooks were up 15.2%, coming in at $1.0 billion for the first eleven months of 2020.
The Downloaded Audio format broke the long-standing trend of seeing continuous growth every month since 2012, with a decline of 1.6% for the November, coming in at $56.0 million in revenue. Physical Audio, however, jumped 30.0% coming in at $4.1 million.
On a year-to-date basis, Downloaded Audio was up 15.2% as compared to the same period in 2019, with a total of $609.6 million for the year so far. Physical Audio was down 27.6%, with $23.9 million in revenue.
Religious Presses
Religious press revenues were up 41.9% in November, coming in at $73.8 million. The category was up 4.0%, with revenues of $610.9 million for the first eleven months of the year.
Education
During November 2020 Education revenues were $253.8 million, down 3.8% compared with November of 2019. Year-to-date Education revenues were down 9.1% as compared to the first eleven months of 2019, coming in at $5.8 billion.
Revenues from Higher Education Course Materials were down 19.0% for the month, as compared to November of 2019, coming in at $106.8 million. On a year-to-date basis, Higher Education revenues were up 1.2% to $2.7 billion.
PreK-12 Instructional Materials revenues were up 26.6% for November 2020, at $86.2 million. PreK-12 Instructional Materials revenues were down 20.0% at $2.5 billion on a year-to-date basis.
Professional Books, including business, medical, law, technical and scientific, were down 4.5% during the month, coming in at $47.6 million. The category was up 2.3% for the first eleven months of the year, with $552.8 million in revenue.
University Presses were down 13.9% as compared to November of 2019, bringing in $3.4 million in revenue. On a year-to-date basis, University Presses rose 2.6%, bringing in $44.7 million for the first eleven months of 2020.
# # #
AAP’s StatShot
Publisher net revenue, including sales to bookstores, wholesalers, direct to consumer, online retailers, etc., is tracked monthly by the Association of American Publishers (AAP) and includes revenue from about 1,360 publishers, with participation subject to change over time.
StatShot reports are designed to give an up-to-date snapshot of the publishing industry using the best data currently available. The reports reflect participants’ most recent reported revenue for current and previous periods, enabling readers to compare revenue on a year-to-year basis within a given StatShot report.
It is not, however, possible to make apples-to-apples comparisons to StatShot reports issued in previous years because: a) The number of StatShot participants fluctuates over time, with the pool of participants growing or shrinking in each report and b) It is a common accounting practices for businesses, including publishers, to restate revenue numbers based on updated information. If, for example, a business learns that its revenues were greater in a given year than its reports indicated, it will restate the revenues in subsequent reports, providing information that is more up-to-date and accurate.